Consider a clinical data set. You can download it from Here. The Diabetes data set consists nine variables. The variable Class is the response variable with a value of tested_positive and a value of tested_negative. The other eight variables are the explanatory variables.
Stepwise logistic regression
-
#read into data
-
diabetes<-read.csv(“d:/diabetes.csv”,head=TRUE)
-
#get explanatory variables
-
#get response variable
-
y<-diabetes[2:769,9]
-
#set explantory variable’s name
- The logistic regression R code is as follows.
Stepwise logistic regression
-
g_fun<-x%*%Beta
-
}
-
pi_value<- pi_fun(x,Beta)
-
}
-
Index<-0;
-
k<-1
-
x1<-Beta;obj<-fun(x,y,Beta);
-
objTemp<-fun(x,y,Beta)
-
Beta<-x1
-
“Results shown are based on the last maximum likelihood iteration. Validity of the model fit is questionable.”));
-
}
-
index<-1;break
-
}
-
k<-k+1
-
}
-
obj<-fun(x,y,Beta);
-
}
-
x[i]<-1e–300
-
}
-
x
-
}
-
#print(“—————–“)
-
#print(LOGL)
-
}
-
pi_value<- pi_fun(x,Beta)
-
##compute Likelihood ratio
-
MF<-ModelFitStat(x,y,Beta)
-
LR_p_value<-pchisq(LR,df,lower.tail=FALSE)
-
##compute Score
-
obj<-funs(x,y,BetaIntercept)
-
Score_p_value<-pchisq(Score,df,lower.tail=FALSE)
-
##compute Wald test
-
obj<-funs(x,y,Beta)
-
Wald_p_value<-pchisq(Wald,df,lower.tail=FALSE)
-
}
-
a<-NULL
-
}
-
}
-
a
-
}
-
}
-
}
-
}
-
}
-
i
-
}
-
NegativeFlg<-NegativeCheck(x)
-
}
-
}
-
##stepwise
-
##as matrix
-
##indication of variable
-
##intercept entered
-
indict[1]<-1
-
Beta<-NULL
-
Result<-Newtons(funs,x[,1],y)
-
Beta<-Result$Beta
-
BetaIntercept<-Result$Beta
-
indexVector<-WhichEqual1(indict)
-
##check other variable
-
VariableFlg<-NULL
-
Terminate<-FALSE
-
print(“Model building terminates because the last effect entered is removed by the Wald statistic criterion. “)
-
}
-
k<-CheckOut(k,indexVector)
-
Score_pvalue<-pchisq(Score,1,lower.tail=FALSE)
-
pvalue[i]<-Score_pvalue
-
}
-
#print(“Score pvalue for variable enter”)
-
#print(pvalue)
-
##set indication of variable
-
indict[j]<-1
-
indexVector<-WhichEqual1(indict)
-
Result<-Newtons(funs,x[,indexVector],y)
-
Beta<-NULL
-
Beta<-Result$Beta
-
##compute model fit statistics
-
MFStat<-ModelFitStat(x[,indexVector],y,Beta)
-
##test globel null hypothesis:Beta=0
-
GNTest<-GlobalNullTest(x[,indexVector],y,Beta,BetaIntercept)
-
##compute Wald test in order to remove variable
-
indexVector<-WhichEqual1(indict)
-
obj<-funs(x[,indexVector],y,Beta)
-
WaldChisqPvalue<-pchisq(WaldChisq,1,lower.tail=FALSE)
-
##check wald to decide to which variable to be removed
-
##set indication of variable
-
indict[indexVector[n+1]]<-0
-
m<- indexVector[n+1]
-
##renew Beta
-
indexVector<-WhichEqual1(indict)
-
Result<-Newtons(funs,x[,indexVector],y)
-
Beta<-NULL
-
Beta<-Result$Beta
-
Terminate<-TRUE
-
}
-
}
-
else {
-
}
-
}##repeat end
-
}
-
else {
-
}
-
}##repeat end
-
##
-
obj<-funs(x[,indexVector],y,Beta)
-
WaldChisqPvalue<-pchisq(WaldChisq,1,lower.tail=FALSE)
-
}
Finally, revoke the stepwise function.
Stepwise logistic regression
-
Stepwise(x,y)
 . The logic regression model is
 ,
, is the probability of
  and
and  . The right-hand side is usually referred to logic function, which can be pictured as follow.
 ,
, ,in other words, the probability of an event that not occurs.
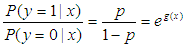 .
. .
.  . It can be achieved by maximum likelihood estimation. Since the probability of an event that occurs is
  , the probability of
  that occurs can be writhed as
  . Likewise, the probability of
  that occurs can be writhed as
  . Thus ,we can get a likelihood function
 with
with  , it can be rewritten as

 , we set the first order partial derivatives of
  to zero.

 ,for j=1,2,…p. we can use the Newton-Raphson iteration method . The matrix of second derivatives, called the Hessian, is

 denotes Hessian matrix, and

 is an n by n diagonal matrix with element
  . We can get


 directly. Since
  is a positive definite matrices, we can get it by Cholesky decomposition on
  .
. is denoted as
  ,this matrix is called the observed information matrix. The variances and covariances of the estimated coefficients can be obtained from the inverse of
  , which represent as
  .that is to say, the variance of
  is the
  diagonal element of matrix
  , and the covariance of
  and
and  , which can be denoted by
  , is the off-diagonal element. So, we can the estimated standard errors of the estimated coefficients as
 , for j=0,1,2,…,p
  :
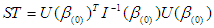
: =0. We can calculate
 is not included in
  and the relevant row and column is not included in
  . This value is distributed as chi-square with
  degrees of freedom.
 (L1) over the maximized value of the likelihood function when
  (L0). The test statistic,